Microservices - Debugging
Create and deploy server-authoritative C# [CLCP-Microservices-07]
Microservices DotNet Requirements
Microservices now requires DotNet 6 to be installed locally on your machine for debugging. You can acquire this directly from Microsoft.
Development of the Beamable Microservices Feature within the Unity client is straight-forward and transparent. It is the ideal environment for development including debugging tools.
Logging
Make logging calls within your C# Microservice to see output in the Unity Console Window. There is a simple approach and an advanced approach. Game makers can freely use either or both approaches.
Simple
Using the typical Debug approach, game makers gt the familiar benefits of Unity logging.
Debug.Log ("This is a test log.");

// And

Debug.Log ("This is a test log with {num}, {str}, {date}", instance.Number, instance.String, instance.Time);
Advanced
Using this advanced approach, game makers benefit from Serilog's library with flexible, structured output and log file convenience.
BeamableLogger.Log ("This is a test log with {num}, {str}, {date}", instance.Number, instance.String, instance.Time);
Breakpoints
Set Breakpoints within your C# Microservice as you normally would. However, some additional setup is needed. First, use the Microservices Manager Window to set "Include Debug Materials=true" (Currently this causes longer build times and cannot be deployed). Secondly, follow the "Debugger Connection Details" within the Microservices Manager Window.
Code Editor Support
Project Settings
Remote debugging settings (host, port, username, password) for Beamable Microservices can be found under Unity Project Settings > Beamable > Microservice > Microservices > Debug Data.
| Name | Windows | Mac |
|---|---|---|
| JetBrain's Rider | ✔️ | ✔️ |
| Microsoft's Visual Studio | ✔️ | |
| Microsoft's Visual Studio Code | ✔️ | ✔️ |
Steps
Follow these steps to get started:
Start: All Code Editors
| Name | Detail |
|---|---|
| 1. Click the menu of the Player button 2. Select "Enable Debug Tools" 3. Run Server | 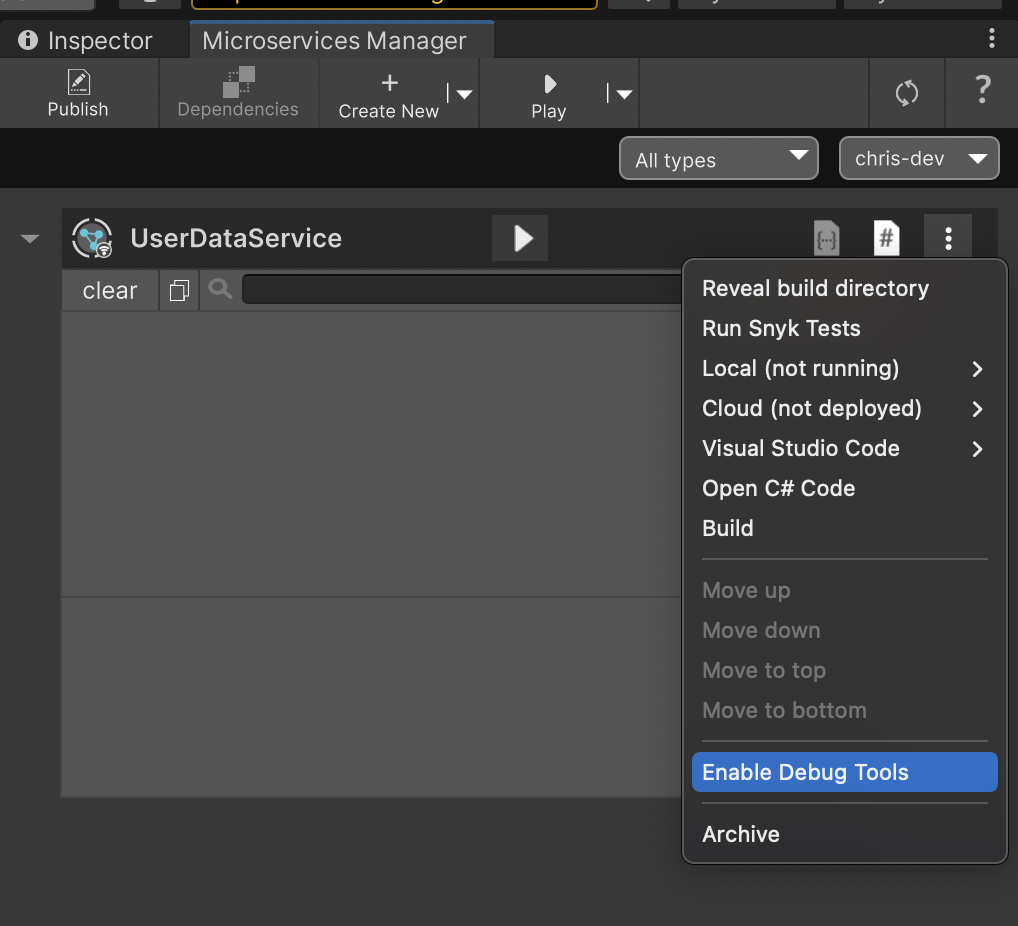 |
JetBrain's Rider
Here are the specific steps for JetBrain's Rider. Repeat similar steps for other code editors.
JetBrains Rider: Version Compatibility
Be sure to use a recent version of Rider which contains support for DotNet 6 debugging (e.g. 2021.3.3) or you may experience a phenomenon where the debugger attaches successfully but does not correctly stop at your breakpoints.
| Name | Detail |
|---|---|
| 4. Use "Debugger Connection Details" | 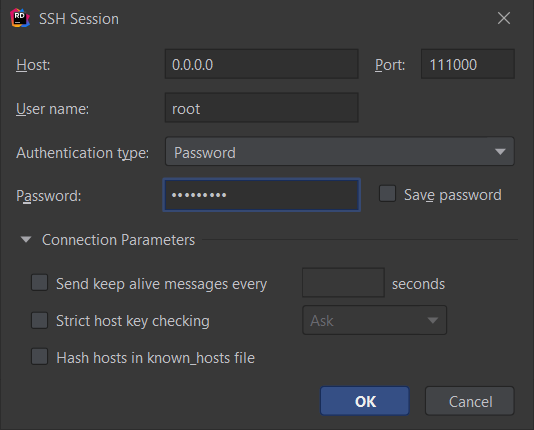 • Rider → Run → Attach To Remote Process → Add Remote Host • Rider → Run → Attach To Remote Process → Add Remote Host• Enter "Host" • Enter "Port" • Enter "Username" • Enter "Password" |
| 6. Set Breakpoint | |
| 7. Attach To Remote Process | • Rider → Run → Attach To Remote Process → Choose Remote Host |
| 8. Start Debugging Session | • Rider → Run → Debug |
| 9. (First time only) Install Debugging Tools if prompted |
Microsoft's Visual Studio
Here are the specific steps for Visual Studio.
Visual Studio: Version Compatibility
Visual Studio debugging requires that you have Visual Studio 2022 or above.
| Name | Detail |
|---|---|
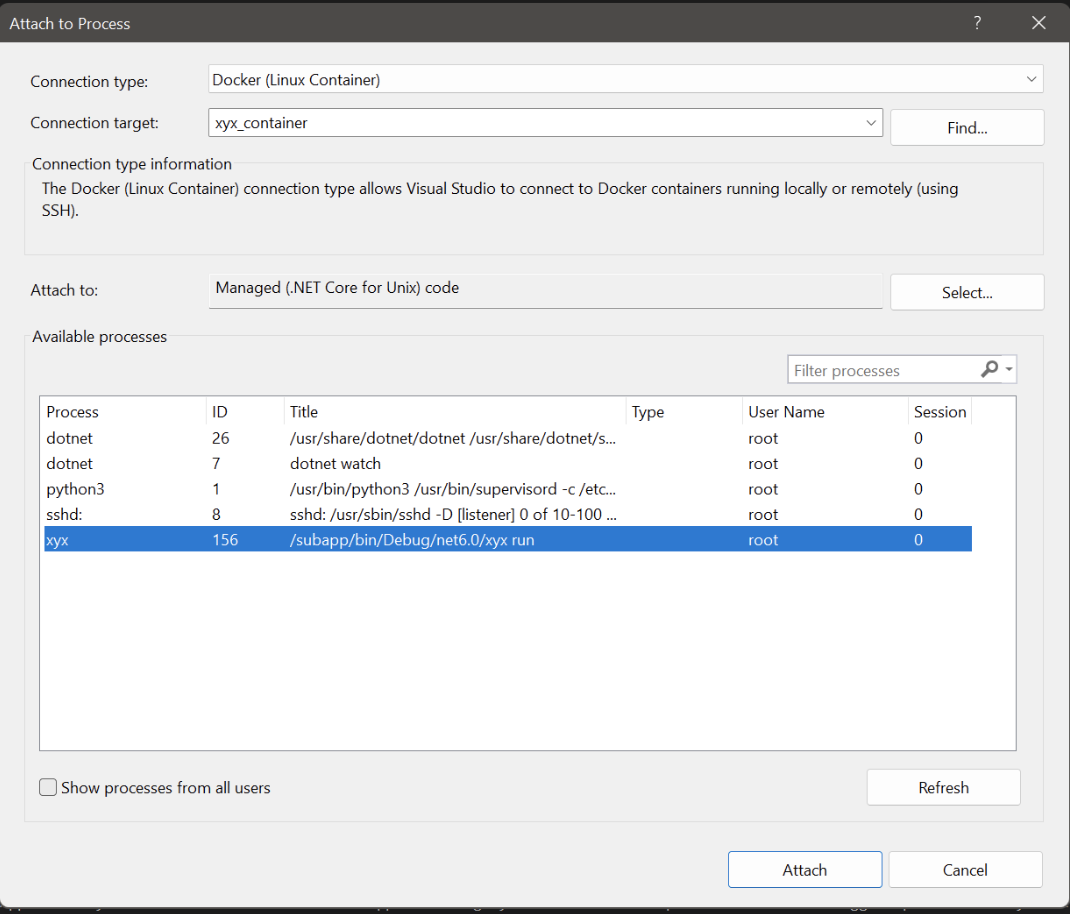
| 4. In Visual Studio, in the Debug menu, select Attach to Process | |
| 5. Configure Connection settings | Change Connection Type to "Docker (Linux Container") and change Connection Target to your Microservice name. Be sure not to select the generator. |
| 6. Select the process with the name of your Microservice. | |
| 7. Click "Attach" to begin debugging. |
Via Microservice OpenAPI
The Portal's Microservice OpenAPI specification is accessible from the Microservices Manager. Game makers use the OpenAPI to call any Microservice method in the project, pass any arguments, and see the result.
Use Cases
- Develop new methods
- Documenting methods and discovering those methods' details
- Debug methods
- Handle customer service (e.g. change the player's in-game name upon customer request)
Security
There are security implications with Microservices. The OpenAPI docs may be publicly accessible depending on configuration. Configuration options include...
Methods marked with the attribute
[AdminCallable]are accessible only to Admin Accounts. This is more secure and recommended whenever feasibleMethods marked with the attribute
[ClientCallable]are accessible to Admin Accounts and standard Accounts. This is less secure
Steps
Follow these steps to get started:
| Name | Detail |
|---|---|
| Open local openAPI documentation. | 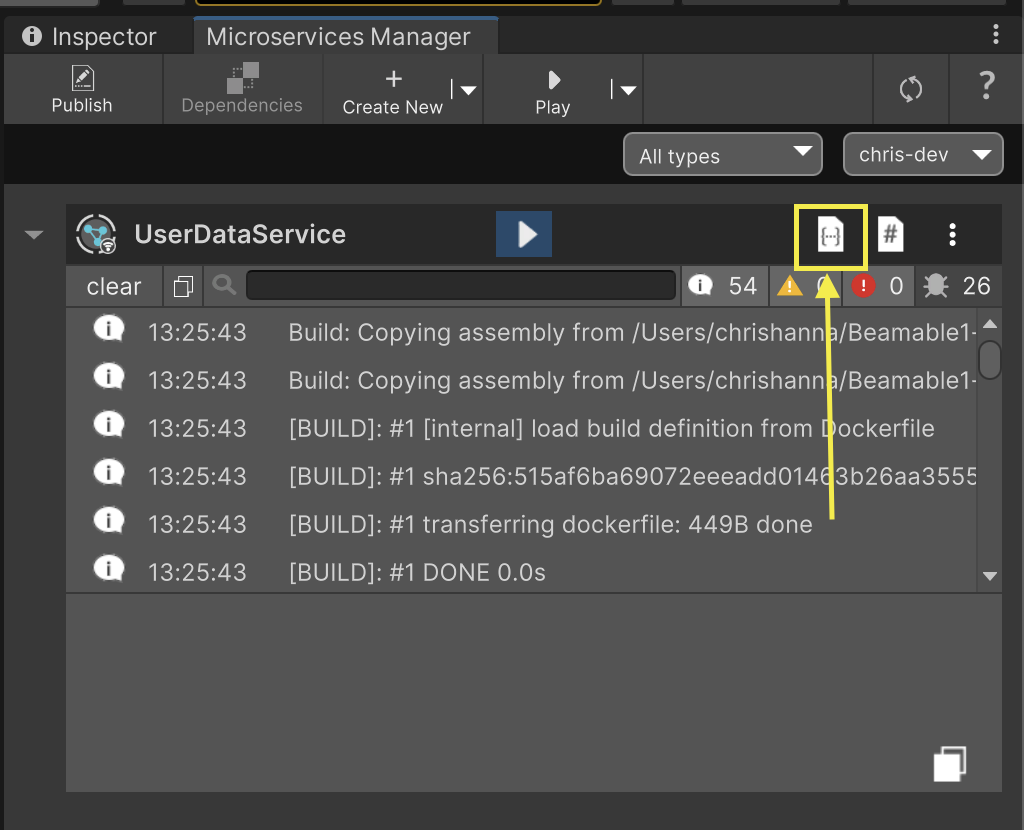 |
| Expand a method to inspect the details. Call the method, pass any parameters, and see the result -- all from within the browser! | 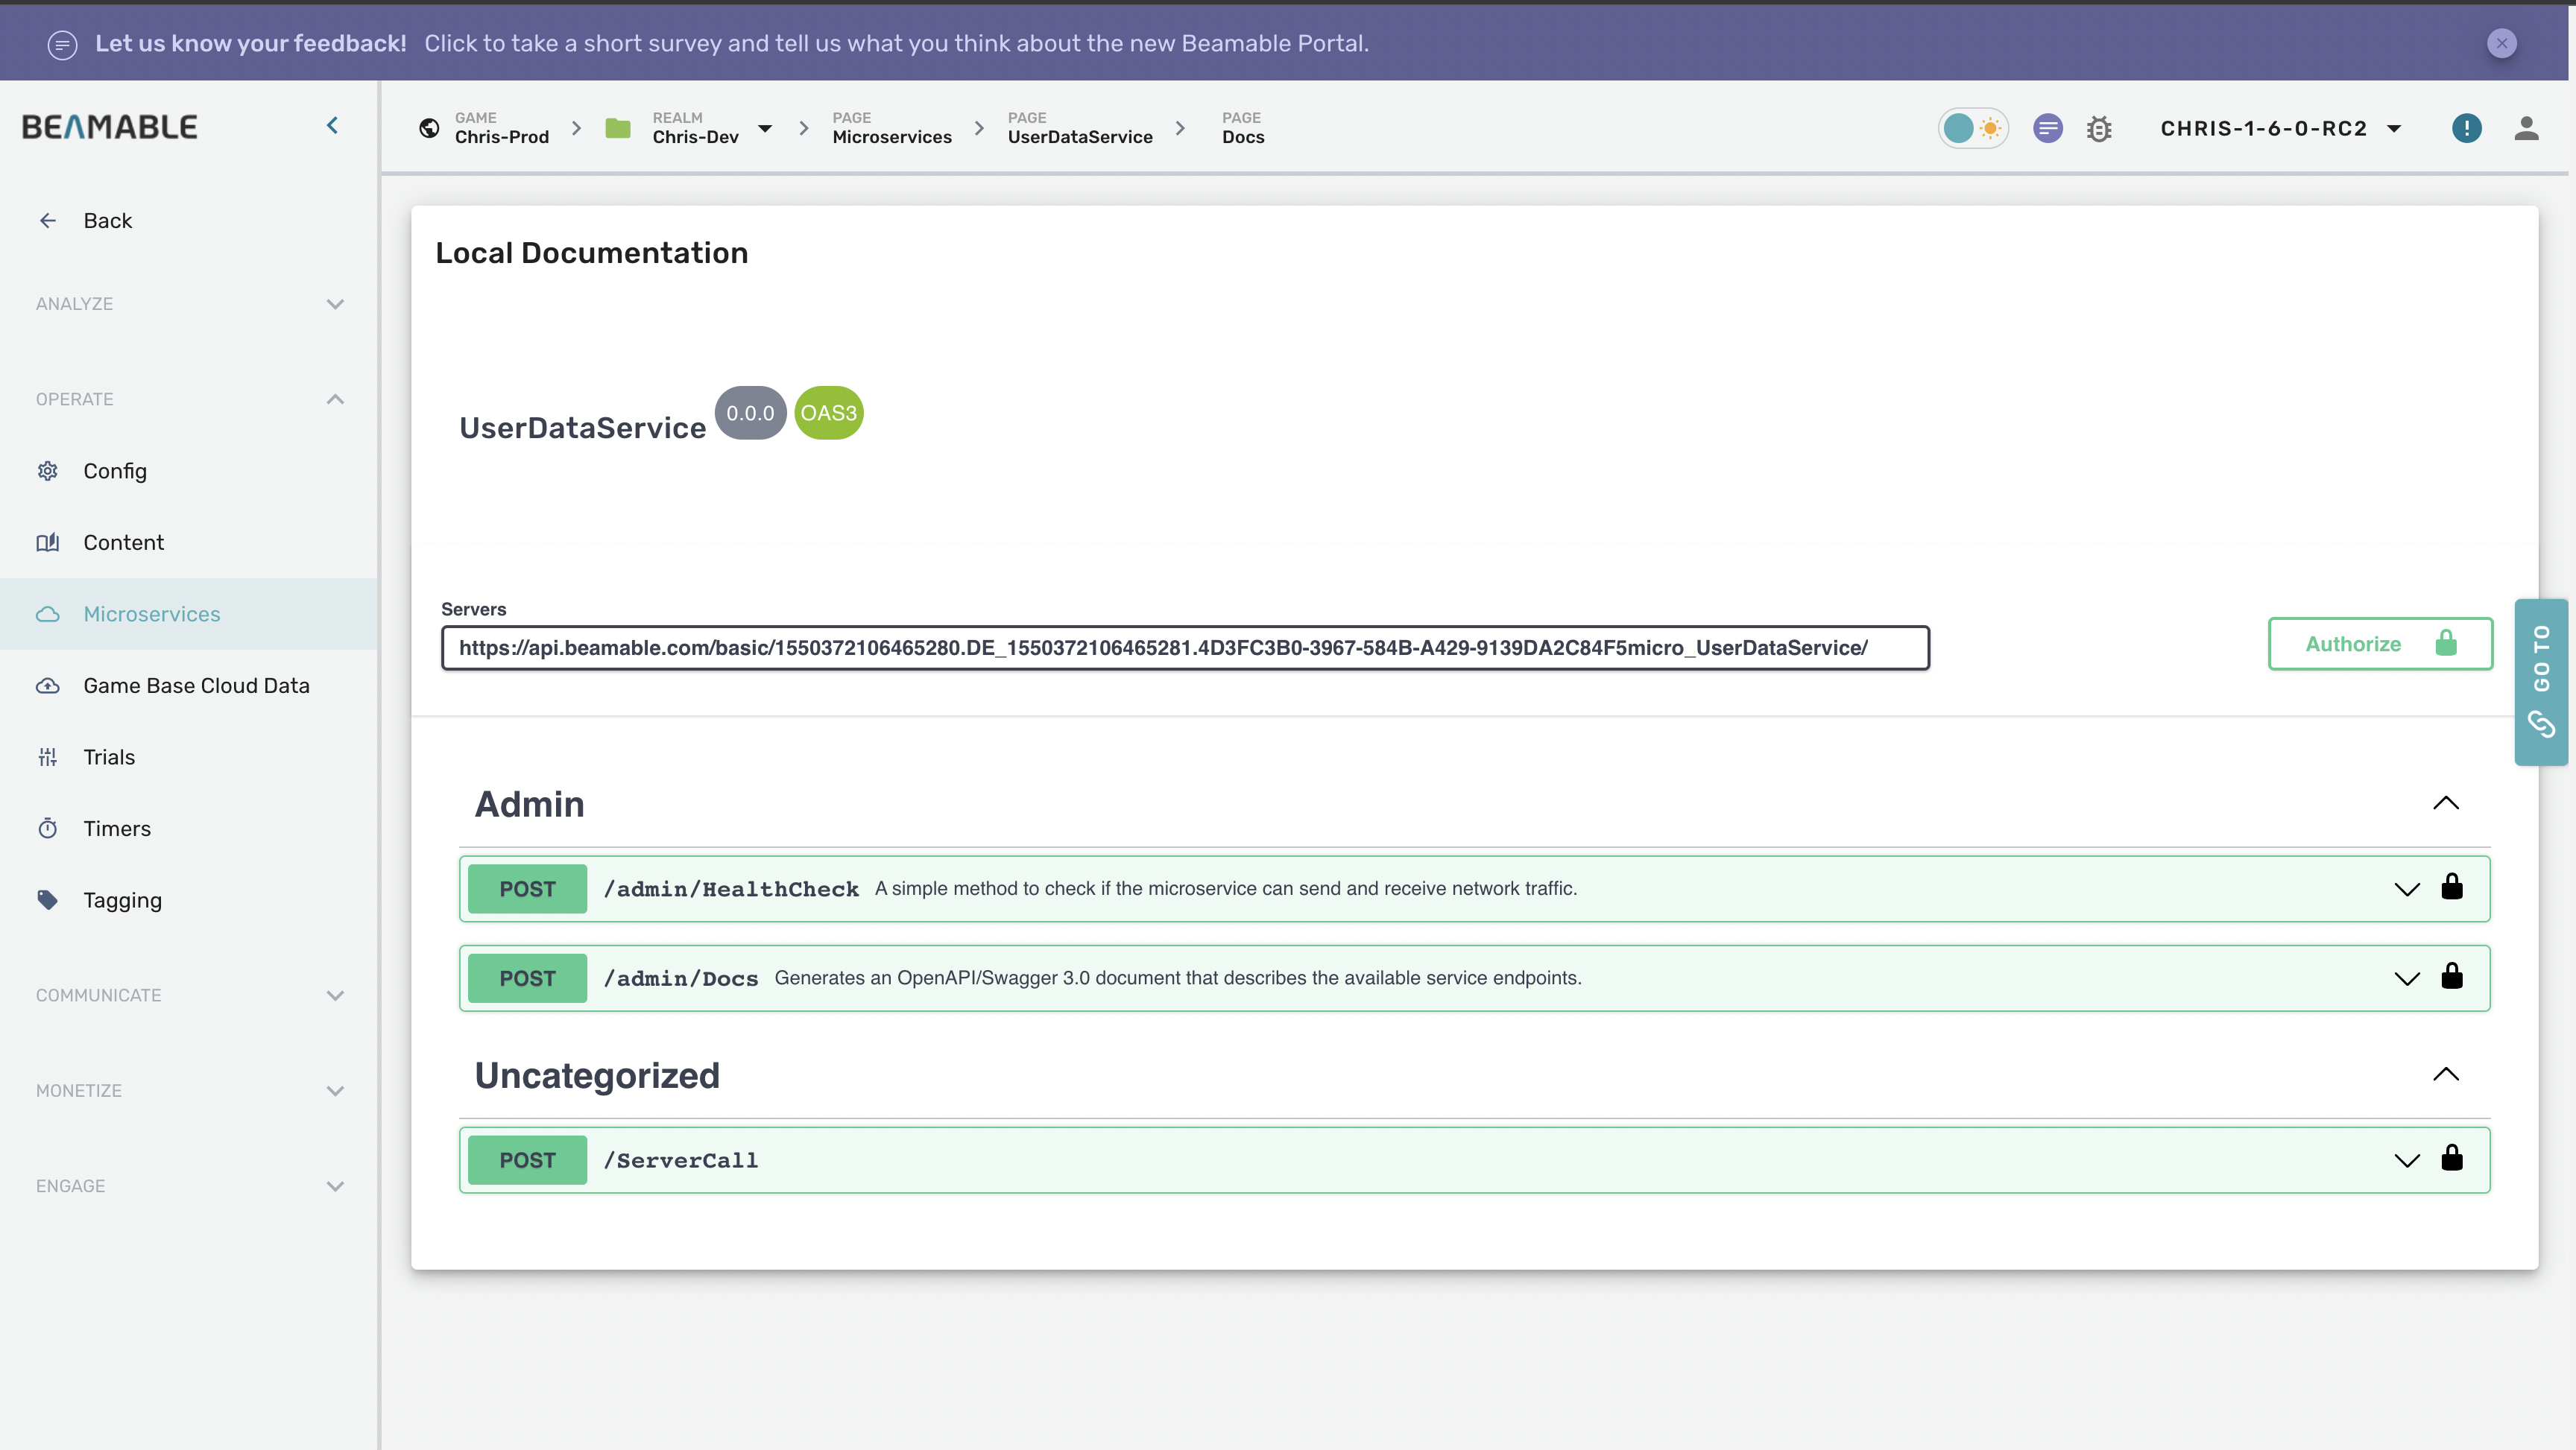 |
Updated 3 months ago